Census 2000 - Population by Race
Norton County
Table containing Population by Race data.
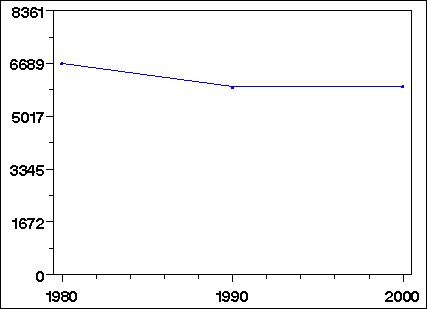
Population by Race - Historical Trends
The 2000 U.S. census changed significantly from preceding censuses in the way race was recorded. In prior years, respondents were forced to place themselves into only one of the categories for race. In 2000 they were allowed to choose as many categories as they wished. In addition the 1990 category: "Asian or Pacific Islander" is tabulated in 2000 as two categories: "Asian" and "Native Hawaiian and other Pacific Islander".
This means that it is not possible to directly compare tabulations by race to previous years. For these graphs we have computed two counts for race for the year 2000:
- An upper limit - those who selected the targeted race alone or in combination with any other race.
- A lower limit - those who selected the targeted race alone.
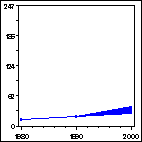
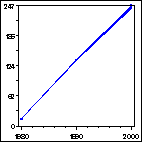
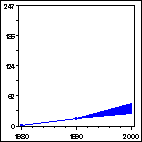
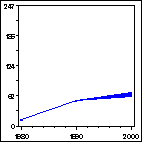
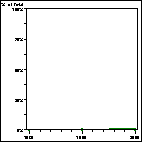
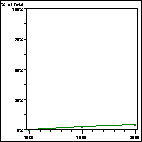
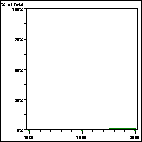
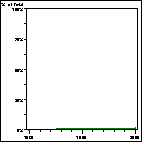
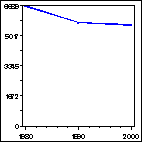
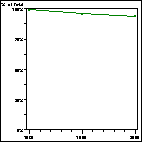
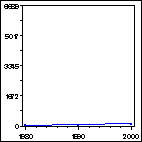
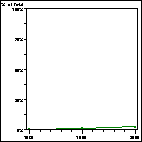
These graphs are a typical line graph between 1980 and 1990 and then have a filled-in triangular area between 1990 and 2000. The right hand edge of the triangle is the range between the lower and upper limits for the number of people of that race. A narrow range indicates that few people selected another race in combination with the targeted race. A broad range means that many people selected another race in combination with this one.
We have also combined the two categories "Asian" and "Native Hawaiian and Other Pacific Islander" into "Asian or Pacific Islander" to allow comparisons with 1980 and 1990.
For more information on Census 2000, please visit the U.S. Bureau of the Census web site.
