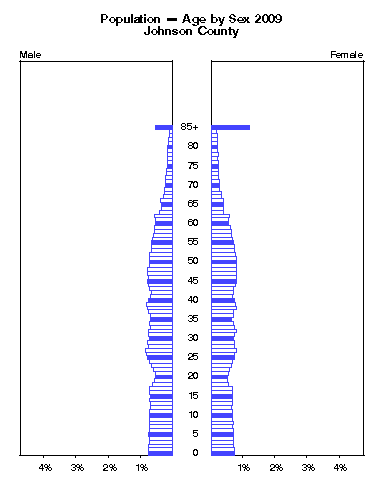
Johnson County -- Estimated Population by Single Year of Age and Sex 2009
|
| AGE | Male | Female |  |
| | Number | Percent | Number | Percent |
| under 1
| 4,136 | 0.8% |
3,932 | 0.7% |
| 1
| 4,130 | 0.8% |
3,920 | 0.7% |
| 2
| 4,121 | 0.8% |
3,866 | 0.7% |
| 3
| 3,916 | 0.7% |
3,787 | 0.7% |
| 4
| 3,919 | 0.7% |
3,791 | 0.7% |
| 5
| 4,045 | 0.7% |
3,781 | 0.7% |
| 6
| 3,974 | 0.7% |
3,875 | 0.7% |
| 7
| 3,976 | 0.7% |
3,662 | 0.7% |
| 8
| 3,901 | 0.7% |
3,865 | 0.7% |
| 9
| 3,984 | 0.7% |
3,744 | 0.7% |
| 10
| 3,934 | 0.7% |
3,723 | 0.7% |
| 11
| 3,848 | 0.7% |
3,638 | 0.7% |
| 12
| 3,765 | 0.7% |
3,526 | 0.6% |
| 13
| 3,790 | 0.7% |
3,730 | 0.7% |
| 14
| 3,838 | 0.7% |
3,716 | 0.7% |
| 15
| 3,723 | 0.7% |
3,617 | 0.7% |
| 16
| 3,822 | 0.7% |
3,581 | 0.7% |
| 17
| 3,828 | 0.7% |
3,578 | 0.7% |
| 18
| 3,442 | 0.6% |
2,934 | 0.5% |
| 19
| 3,005 | 0.6% |
2,745 | 0.5% |
| 20
| 2,887 | 0.5% |
2,745 | 0.5% |
| 21
| 2,913 | 0.5% |
2,882 | 0.5% |
Click the figure above to animate by year. |
| 22
| 3,211 | 0.6% |
3,130 | 0.6% |
| 23
| 3,551 | 0.7% |
3,454 | 0.6% |
| 24
| 3,937 | 0.7% |
3,713 | 0.7% |
Institute for Policy & Social Research
.
https://ipsr.ku.edu/
The University of Kansas
Source:
Data used in this report are from the National Center for Health Statistics.
http://www.cdc.gov/nchs/nvss/bridged_race.htm
These estimates were prepared by the Population Estimates Program of the U.S. Census Bureau
under a collaborative agreement with NCHS. Released July 23, 2010.
Please email comments to:ipsr@ku.edu
These data, plus 2000-2008, are also available in Excel at:
https://ipsr.ku.edu/ksdata/census/estpop/sya09/sya20091.xls
|
| 25
| 4,164 | 0.8% |
4,060 | 0.7% |
| 26
| 4,365 | 0.8% |
4,057 | 0.7% |
| 27
| 4,639 | 0.9% |
4,322 | 0.8% |
| 28
| 4,095 | 0.8% |
3,892 | 0.7% |
| 29
| 4,200 | 0.8% |
4,002 | 0.7% |
| 30
| 3,871 | 0.7% |
3,818 | 0.7% |
| 31
| 4,049 | 0.7% |
4,014 | 0.7% |
| 32
| 4,056 | 0.7% |
4,306 | 0.8% |
| 33
| 3,761 | 0.7% |
3,941 | 0.7% |
| 34
| 3,976 | 0.7% |
3,836 | 0.7% |
| 35
| 3,809 | 0.7% |
3,552 | 0.7% |
| 36
| 3,760 | 0.7% |
3,783 | 0.7% |
| 37
| 4,034 | 0.7% |
3,847 | 0.7% |
| 38
| 4,204 | 0.8% |
4,345 | 0.8% |
| 39
| 4,447 | 0.8% |
4,154 | 0.8% |
| 40
| 4,044 | 0.7% |
3,960 | 0.7% |
| 41
| 3,697 | 0.7% |
3,727 | 0.7% |
| 42
| 3,681 | 0.7% |
3,757 | 0.7% |
| 43
| 3,870 | 0.7% |
3,849 | 0.7% |

