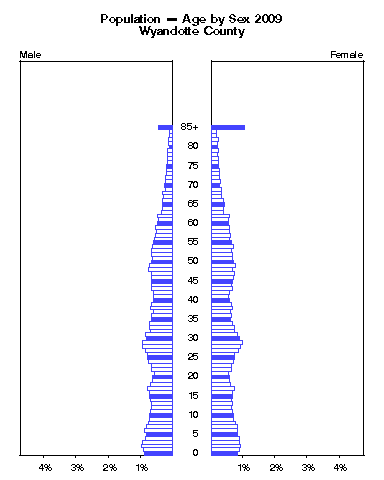
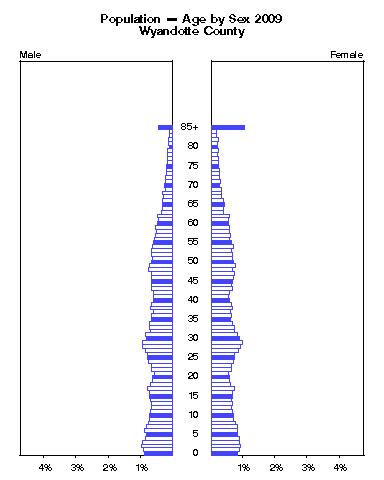
Wyandotte County -- Estimated Population by Single Year of Age and Sex 2009
|
| AGE | Male | Female |  |
| | Number | Percent | Number | Percent |
| under 1
| 1,355 | 0.9% |
1,303 | 0.8% |
| 1
| 1,411 | 0.9% |
1,395 | 0.9% |
| 2
| 1,480 | 1.0% |
1,435 | 0.9% |
| 3
| 1,479 | 1.0% |
1,366 | 0.9% |
| 4
| 1,329 | 0.9% |
1,364 | 0.9% |
| 5
| 1,247 | 0.8% |
1,306 | 0.8% |
| 6
| 1,361 | 0.9% |
1,282 | 0.8% |
| 7
| 1,248 | 0.8% |
1,290 | 0.8% |
| 8
| 1,166 | 0.8% |
1,182 | 0.8% |
| 9
| 1,134 | 0.7% |
1,104 | 0.7% |
| 10
| 1,122 | 0.7% |
1,107 | 0.7% |
| 11
| 1,080 | 0.7% |
1,047 | 0.7% |
| 12
| 1,045 | 0.7% |
970 | 0.6% |
| 13
| 1,029 | 0.7% |
1,046 | 0.7% |
| 14
| 1,066 | 0.7% |
977 | 0.6% |
| 15
| 1,143 | 0.7% |
1,018 | 0.7% |
| 16
| 1,133 | 0.7% |
1,030 | 0.7% |
| 17
| 1,191 | 0.8% |
1,119 | 0.7% |
| 18
| 1,069 | 0.7% |
931 | 0.6% |
| 19
| 967 | 0.6% |
906 | 0.6% |
| 20
| 984 | 0.6% |
885 | 0.6% |
| 21
| 902 | 0.6% |
862 | 0.6% |
Click the figure above to animate by year. |
| 22
| 1,018 | 0.7% |
987 | 0.6% |
| 23
| 1,052 | 0.7% |
989 | 0.6% |
| 24
| 1,175 | 0.8% |
1,086 | 0.7% |
Institute for Policy & Social Research
.
https://ipsr.ku.edu/
The University of Kansas
Source:
Data used in this report are from the National Center for Health Statistics.
http://www.cdc.gov/nchs/nvss/bridged_race.htm
These estimates were prepared by the Population Estimates Program of the U.S. Census Bureau
under a collaborative agreement with NCHS. Released July 23, 2010.
Please email comments to:ipsr@ku.edu
These data, plus 2000-2008, are also available in Excel at:
https://ipsr.ku.edu/ksdata/census/estpop/sya09/sya20209.xls
|
| 25
| 1,216 | 0.8% |
1,136 | 0.7% |
| 26
| 1,221 | 0.8% |
1,110 | 0.7% |
| 27
| 1,306 | 0.8% |
1,321 | 0.9% |
| 28
| 1,477 | 1.0% |
1,419 | 0.9% |
| 29
| 1,444 | 0.9% |
1,506 | 1.0% |
| 30
| 1,258 | 0.8% |
1,392 | 0.9% |
| 31
| 1,320 | 0.9% |
1,290 | 0.8% |
| 32
| 1,072 | 0.7% |
1,158 | 0.7% |
| 33
| 1,095 | 0.7% |
1,144 | 0.7% |
| 34
| 1,113 | 0.7% |
1,059 | 0.7% |
| 35
| 1,010 | 0.7% |
929 | 0.6% |
| 36
| 1,013 | 0.7% |
1,009 | 0.7% |
| 37
| 924 | 0.6% |
950 | 0.6% |
| 38
| 1,083 | 0.7% |
1,032 | 0.7% |
| 39
| 1,023 | 0.7% |
986 | 0.6% |
| 40
| 926 | 0.6% |
912 | 0.6% |
| 41
| 918 | 0.6% |
867 | 0.6% |
| 42
| 922 | 0.6% |
892 | 0.6% |
| 43
| 1,042 | 0.7% |
1,018 | 0.7% |

