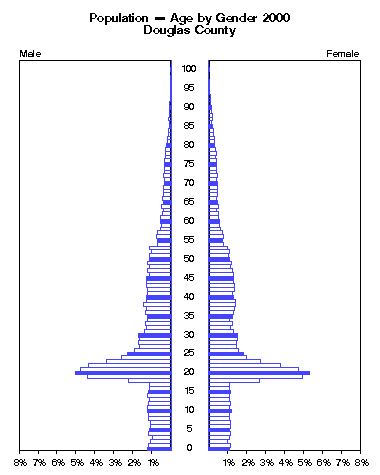
Douglas County -- Population by Single Year of Age and Gender 2000
AGEMaleFemaleClick to animate.
 NumberPercentNumberPercent
under 1 year 611 1.2% 552 1.1%
  1 594 1.2% 566 1.1%
  2 534 1.1% 511 1.0%
  3 495 1.0% 549 1.1%
  4 591 1.2% 565 1.1%
  5 550 1.1% 544 1.1%
  6 521 1.0% 579 1.2%
  7 543 1.1% 582 1.2%
  8 594 1.2% 553 1.1%
  9 587 1.2% 544 1.1%
10 622 1.3% 608 1.2%
11 619 1.2% 550 1.1%
12 590 1.2% 589 1.2%
13 566 1.1% 553 1.1%
14 596 1.2% 538 1.1%
15 589 1.2% 582 1.2%
16 568 1.1% 545 1.1%
17 572 1.2% 549 1.1%
18 1120 2.3% 1339 2.7%
19 2183 4.4% 2492 5.0%
20 2487 5.0% 2686 5.3%
Click the figure above to animate by years.
21 2368 4.8% 2367 4.7%
22 2147 4.3% 1898 3.8%
23 1679 3.4% 1362 2.7%

Policy Research Institute
http://www.ku.edu/pri

The University of Kansas

Source:
U.S. Bureau of the Census,
1980 data from Summary Tape File 2B
1990 data from Summary Tape File 2B
2000 data from Summary File 1

Please email comments to: pri@ku.edu
24 1295 2.6% 997 2.0%
25 1144 2.3% 932 1.9%
26 960 1.9% 778 1.5%
27 827 1.7% 753 1.5%
28 845 1.7% 726 1.4%
29 817 1.6% 755 1.5%
30 838 1.7% 768 1.5%
31 687 1.4% 645 1.3%
32 634 1.3% 588 1.2%
33 668 1.3% 619 1.2%
34 605 1.2% 559 1.1%
35 610 1.2% 631 1.3%
36 660 1.3% 664 1.3%
37 627 1.3% 680 1.4%
38 707 1.4% 723 1.4%
39 642 1.3% 710 1.4%
40 649 1.3% 673 1.3%
41 599 1.2% 643 1.3%
42 611 1.2% 675 1.3%

(Douglas County continued)

AGEMaleFemale Click to animate.
 NumberPercentNumberPercent
43 643 1.3% 681 1.4%
44 642 1.3% 674 1.3%
45 645 1.3% 651 1.3%
46 560 1.1% 658 1.3%
47 596 1.2% 643 1.3%
48 566 1.1% 578 1.1%
49 612 1.2% 597 1.2%
50 549 1.1% 548 1.1%
51 562 1.1% 521 1.0%
52 504 1.0% 542 1.1%
53 551 1.1% 511 1.0%
54 364 0.7% 391 0.8%
55 366 0.7% 375 0.7%
56 374 0.8% 384 0.8%
57 347 0.7% 373 0.7%
58 261 0.5% 317 0.6%
59 247 0.5% 277 0.6%
60 264 0.5% 280 0.6%
61 266 0.5% 252 0.5%
62 227 0.5% 247 0.5%
63 208 0.4% 215 0.4%
Click the figure above to animate by years.
64 236 0.5% 247 0.5%
65 196 0.4% 239 0.5%

Policy Research Institute
http://www.ku.edu/pri

The University of Kansas

Source:
U.S. Bureau of the Census,
1980 data from Summary Tape File 2B
1990 data from Summary Tape File 2B
2000 data from Summary File 1

Please email comments to: pri@ku.edu
66 210 0.4% 219 0.4%
67 196 0.4% 232 0.5%
68 184 0.4% 222 0.4%
69 189 0.4% 232 0.5%
70 174 0.4% 227 0.5%
71 170 0.3% 198 0.4%
72 194 0.4% 226 0.4%
73 159 0.3% 193 0.4%
74 175 0.4% 214 0.4%
75 169 0.3% 214 0.4%
76 149 0.3% 205 0.4%
77 137 0.3% 189 0.4%
78 131 0.3% 198 0.4%
79 136 0.3% 169 0.3%
80 125 0.3% 155 0.3%
81 92 0.2% 153 0.3%
82 91 0.2% 145 0.3%
83 75 0.2% 137 0.3%
84 70 0.1% 120 0.2%
85 43 0.1% 105 0.2%
86 38 0.1% 89 0.2%
87 57 0.1% 99 0.2%
88 31 0.1% 93 0.2%
89 20 0.0% 62 0.1%
90 29 0.1% 63 0.1%
91 20 0.0% 60 0.1%
92 12 0.0% 41 0.1%
93 9 0.0% 34 0.1%
94 6 0.0% 26 0.1%
95 12 0.0% 17 0.0%
96 3 0.0% 12 0.0%
97 1 0.0% 12 0.0%
98 4 0.0% 9 0.0%
99 0 0.0% 3 0.0%
100 to 104 3 0.0% 12 0.0%
105 to 109 0 0.0% 3 0.0%
110 and over 0 0.0% 0 0.0%