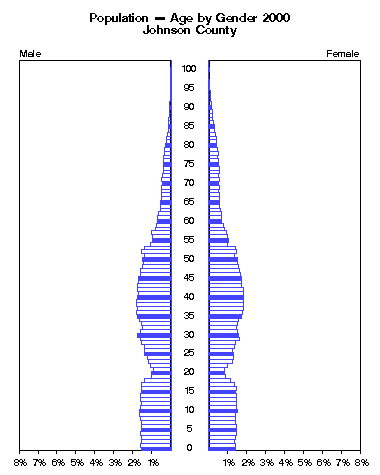
Johnson County -- Population by Single Year of Age and Gender 2000
AGEMaleFemaleClick to animate.
 NumberPercentNumberPercent
under 1 year 3474 1.6% 3207 1.4%
  1 3488 1.6% 3288 1.4%
  2 3416 1.6% 3180 1.4%
  3 3439 1.6% 3194 1.4%
  4 3511 1.6% 3444 1.5%
  5 3459 1.6% 3327 1.4%
  6 3412 1.5% 3337 1.4%
  7 3450 1.6% 3270 1.4%
  8 3522 1.6% 3289 1.4%
  9 3694 1.7% 3316 1.4%
10 3654 1.7% 3499 1.5%
11 3495 1.6% 3361 1.5%
12 3437 1.6% 3367 1.5%
13 3523 1.6% 3349 1.5%
14 3547 1.6% 3362 1.5%
15 3428 1.6% 3195 1.4%
16 3351 1.5% 3326 1.4%
17 3383 1.5% 3174 1.4%
18 3075 1.4% 2698 1.2%
19 2239 1.0% 2014 0.9%
20 2232 1.0% 1984 0.9%
Click the figure above to animate by years.
21 2063 0.9% 1967 0.9%
22 2293 1.0% 2319 1.0%
23 2620 1.2% 2877 1.2%

Policy Research Institute
http://www.ku.edu/pri

The University of Kansas

Source:
U.S. Bureau of the Census,
1980 data from Summary Tape File 2B
1990 data from Summary Tape File 2B
2000 data from Summary File 1

Please email comments to: pri@ku.edu
24 2747 1.2% 2981 1.3%
25 3074 1.4% 3046 1.3%
26 3055 1.4% 2934 1.3%
27 3081 1.4% 3175 1.4%
28 3389 1.5% 3317 1.4%
29 3558 1.6% 3780 1.6%
30 3905 1.8% 3664 1.6%
31 3521 1.6% 3472 1.5%
32 3287 1.5% 3395 1.5%
33 3404 1.5% 3534 1.5%
34 3575 1.6% 3593 1.6%
35 3888 1.8% 3941 1.7%
36 3979 1.8% 4144 1.8%
37 3914 1.8% 4209 1.8%
38 4017 1.8% 4179 1.8%
39 4027 1.8% 4198 1.8%
40 3875 1.8% 4223 1.8%
41 3740 1.7% 4194 1.8%
42 3864 1.8% 4254 1.8%

(Johnson County continued)

AGEMaleFemale Click to animate.
 NumberPercentNumberPercent
43 3905 1.8% 4053 1.8%
44 3752 1.7% 3953 1.7%
45 3703 1.7% 4028 1.7%
46 3556 1.6% 3805 1.6%
47 3490 1.6% 3708 1.6%
48 3344 1.5% 3639 1.6%
49 3228 1.5% 3537 1.5%
50 3300 1.5% 3463 1.5%
51 3092 1.4% 3158 1.4%
52 3367 1.5% 3359 1.5%
53 3109 1.4% 3273 1.4%
54 2337 1.1% 2271 1.0%
55 2161 1.0% 2357 1.0%
56 2127 1.0% 2288 1.0%
57 2204 1.0% 2213 1.0%
58 1818 0.8% 1875 0.8%
59 1647 0.7% 1838 0.8%
60 1540 0.7% 1586 0.7%
61 1515 0.7% 1586 0.7%
62 1384 0.6% 1481 0.6%
63 1268 0.6% 1393 0.6%
Click the figure above to animate by years.
64 1246 0.6% 1378 0.6%
65 1163 0.5% 1360 0.6%

Policy Research Institute
http://www.ku.edu/pri

The University of Kansas

Source:
U.S. Bureau of the Census,
1980 data from Summary Tape File 2B
1990 data from Summary Tape File 2B
2000 data from Summary File 1

Please email comments to: pri@ku.edu
66 1063 0.5% 1261 0.5%
67 1122 0.5% 1269 0.5%
68 1028 0.5% 1244 0.5%
69 1039 0.5% 1325 0.6%
70 967 0.4% 1239 0.5%
71 1029 0.5% 1264 0.5%
72 967 0.4% 1237 0.5%
73 921 0.4% 1260 0.5%
74 914 0.4% 1249 0.5%
75 886 0.4% 1211 0.5%
76 873 0.4% 1177 0.5%
77 801 0.4% 1081 0.5%
78 782 0.4% 1151 0.5%
79 709 0.3% 1062 0.5%
80 581 0.3% 1001 0.4%
81 510 0.2% 882 0.4%
82 469 0.2% 879 0.4%
83 400 0.2% 755 0.3%
84 342 0.2% 701 0.3%
85 310 0.1% 677 0.3%
86 255 0.1% 604 0.3%
87 224 0.1% 486 0.2%
88 174 0.1% 443 0.2%
89 137 0.1% 430 0.2%
90 106 0.0% 368 0.2%
91 93 0.0% 303 0.1%
92 81 0.0% 236 0.1%
93 71 0.0% 210 0.1%
94 40 0.0% 160 0.1%
95 26 0.0% 127 0.1%
96 19 0.0% 102 0.0%
97 13 0.0% 60 0.0%
98 8 0.0% 41 0.0%
99 3 0.0% 21 0.0%
100 to 104 5 0.0% 56 0.0%
105 to 109 0 0.0% 6 0.0%
110 and over 0 0.0% 0 0.0%