
|
• Housing Units • Occupancy Status • Vacancy Rates • Median Value | • Housing Stock • Age of Housing Stock • Housing Affordability • Housing Costs |
| Select a region: | Map of Flint Hills Regional Council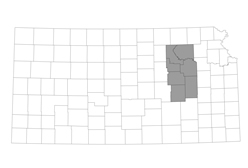 |
Housing

Housing Units
| Percent Change | |||||||
| Area | 2010 | 2020 | 2024 | 2010 - 2020 | 2020 - 2024 | ||
| Chase | 1,503 | 1,397 | 1,395 | -7.1 | -0.1 | ||
| Geary | 14,517 | 15,928 | 15,979 | 9.7 | 0.3 | ||
| Lyon | 15,237 | 14,957 | 15,128 | -1.8 | 1.1 | ||
| Morris | 3,206 | 2,996 | 2,998 | -6.6 | 0.1 | ||
| Pottawatomie | 8,626 | 9,866 | 10,485 | 14.4 | 6.3 | ||
| Riley | 28,212 | 30,477 | 30,960 | 8.0 | 1.6 | ||
| Wabaunsee | 3,227 | 3,110 | 3,180 | -3.6 | 2.3 | ||
| Flint Hills Regional Council | 74,528 | 78,731 | 80,125 | 5.6 | 1.8 | ||
| State of Kansas | 1,233,215 | 1,275,689 | 1,310,506 | 3.4 | 2.7 | ||
Source: U.S. Census Bureau: Decennial Census and Housing Unit Estimates
Also see:
Occupancy Status
| Occupied Housing Units | ||||||
| Vacant Units | Renter Occupied | Owner Occupied | ||||
| Area | 2010 | 2020 | 2010 | 2020 | 2010 | 2020 |
| Chase | 353 | 341 | 259 | 247 | 891 | 809 |
| Geary | 1,827 | 2,440 | 6,746 | 7,711 | 5,944 | 5,777 |
| Lyon | 1,934 | 1,774 | 5,026 | 5,107 | 8,277 | 8,076 |
| Morris | 652 | 702 | 576 | 537 | 1,978 | 1,757 |
| Pottawatomie | 748 | 816 | 1,676 | 1,928 | 6,202 | 7,122 |
| Riley | 2,416 | 3,766 | 15,003 | 15,348 | 10,793 | 11,363 |
| Wabaunsee | 490 | 451 | 451 | 417 | 2,286 | 2,242 |
| Flint Hills Regional Council | 8,420 | 10,290 | 29,737 | 31,295 | 36,371 | 37,146 |
| State of Kansas | 121,119 | 124,329 | 358,564 | 399,417 | 753,532 | 751,943 |
Source: U.S. Census Bureau: Decennial Census
Homeowner Vacancy Rate
| Percent Change | |||||||
| Area | 2000 | 2010 | 2023 | 2000 - 2010 | 2010 - 2023 | ||
| Chase | 3.6 | 2.3 | 0.2 | -36.1 | -91.3 | ||
| Geary | 2.9 | 3.2 | 5.3 | 10.3 | 65.6 | ||
| Lyon | 1.6 | 2.1 | 0.7 | 31.2 | -66.7 | ||
| Morris | 1.8 | 2.2 | 2.8 | 22.2 | 27.3 | ||
| Pottawatomie | 1.4 | 2.2 | 2.1 | 57.1 | -4.5 | ||
| Riley | 2.0 | 2.4 | 2.5 | 20.0 | 4.2 | ||
| Wabaunsee | 2.8 | 1.3 | 2.0 | -53.6 | 53.8 | ||
| Flint Hills Regional Council Average | 2.3 | 2.2 | 2.2 | -2.5 | -0.6 | ||
| State of Kansas | 2.0 | 2.1 | 1.1 | 5.0 | -47.6 | ||
Source: U.S. Census Bureau: Decennial Census and American Community Survey five-year average ending in year shown
Rental Vacancy Rate
| Percent Change | |||||||
| Area | 2000 | 2010 | 2023 | 2000 - 2010 | 2010 - 2023 | ||
| Chase | 5.1 | 9.7 | 9.9 | 90.2 | 2.1 | ||
| Geary | 12.8 | 13.3 | 8.4 | 3.9 | -36.8 | ||
| Lyon | 8.2 | 16.1 | 3.2 | 96.3 | -80.1 | ||
| Morris | 7.6 | 7.8 | 5.1 | 2.6 | -34.6 | ||
| Pottawatomie | 8.3 | 9.2 | 6.8 | 10.8 | -26.1 | ||
| Riley | 4.1 | 7.0 | 6.7 | 70.7 | -4.3 | ||
| Wabaunsee | 7.9 | 9.5 | 3.5 | 20.3 | -63.2 | ||
| Flint Hills Regional Council Average | 7.7 | 10.4 | 6.2 | 34.4 | -39.9 | ||
| State of Kansas | 8.8 | 10.1 | 6.5 | 14.8 | -35.6 | ||
Source: U.S. Census Bureau: Decennial Census and American Community Survey five-year average ending in year shown
Median Value of Owner-Occupied Housing Units
| Percent Change | ||||
| Area | 2018 | 2023 | 2018 - 2023 | |
| Chase | 96,200 | 106,200 | 10.4 | |
| Geary | 142,200 | 165,000 | 16.0 | |
| Lyon | 104,100 | 142,200 | 36.6 | |
| Morris | 101,200 | 120,900 | 19.5 | |
| Pottawatomie | 181,200 | 223,000 | 23.1 | |
| Riley | 194,800 | 231,200 | 18.7 | |
| Wabaunsee | 129,100 | 178,200 | 38.0 | |
| Flint Hills Regional Council Average | 135,543 | 166,671 | 23.0 | |
| State of Kansas | 145,400 | 203,400 | 39.9 | |
Source: U.S. Census Bureau, Decennial Census (- 2000), (2009 -) American Community Survey five-year average ending in year shown.
Housing Stock
| Percent Change | ||||
| Housing Type | 2018 | 2023 | 2018 - 2023 | |
| Single family homes, detached | 46,494 | 46,183 | -0.7 | |
| Apartments | 14,448 | 14,042 | -2.8 | |
| Single family homes, attached | 4,926 | 5,978 | 21.4 | |
| Mobile homes | 5,198 | 5,578 | 7.3 | |
| Tri- and Quadplex units | 3,461 | 3,957 | 14.3 | |
| Duplex units | 4,090 | 3,426 | -16.2 | |
| Other homes - boat, rv, van, etc. | 143 | 25 | -82.5 | |
Source: U.S. Census Bureau, American Community Survey five-year average ending in year shown.
Percent of Housing Units Built Before 1940
| Percent Change | ||||
| Area | 2018 | 2023 | 2018 - 2023 | |
| Chase | 36.0 | 30.9 | -14.2 | |
| Geary | 10.8 | 11.9 | 10.2 | |
| Lyon | 27.9 | 28.7 | 2.9 | |
| Morris | 28.9 | 37.9 | 31.1 | |
| Pottawatomie | 18.1 | 16.8 | -7.2 | |
| Riley | 9.6 | 8.3 | -13.5 | |
| Wabaunsee | 38.9 | 34.8 | -10.5 | |
| State of Kansas | 16.6 | 15.5 | -6.6 | |
Source: U.S. Census Bureau, Decennial Census (- 2000), (2009 -) American Community Survey five-year average ending in year shown.
Housing Affordability
| Percent Change | ||||
| Area | 2018 | 2023 | 2018 - 2023 | |
| Chase | 261 | 281 | 7.5 | |
| Geary | 188 | 190 | 1.2 | |
| Lyon | 230 | 227 | -1.4 | |
| Morris | 270 | 257 | -5.0 | |
| Pottawatomie | 194 | 215 | 11.0 | |
| Riley | 139 | 141 | 1.3 | |
| Wabaunsee | 254 | 216 | -14.8 | |
| State of Kansas | 214 | 195 | -8.9 | |
Source: U.S. Census Bureau, Decennial Census (- 2000), (2009 -) American Community Survey five-year average ending in year shown.
Also see:
- [Interactive] Renters Spending 30% or More of Household Income on Rent in Kansas, by County (Kansas Health Matters)
- [Table] Fair Market Rents in Kansas, by County [Excel] [PDF]
- [Table] Mean Renter Wage, Housing Wage, and Work Hours Needed to Afford Fair Market Rent in Kansas, by County[Excel] [PDF]
The housing affordability index is calculated such that a value of 100 indicates a household has exactly enough income to qualify for a 30-year conventional mortagage on a median valued home assuming a 20% down payment, qualifying median household income of 25% of the expected monthly payment (excluding PMI and property taxes), and 5-year average of 30-year mortgage interest rates shown in the table below. An index value of 200 indicates housholds earning the median household income have 200% of the income neccesary to qualify for a conventional loan for 80% of the value of a median-priced home.
| Period | Average 30-year Mortgage Interest Rate |
| 2012-2016 | 3.654% |
| 2013-2017 | 3.928% |
| 2014-2018 | 4.041% |
| 2015-2019 | 3.995% |
| 2016-2020 | 3.847% |
| 2017-2021 | 3.708% |
| 2018-2022 | 3.979% |
| Source: Board of Governors of the Federal Reserve System and Freddie Mac | |

[Also available as PDF or JPG]
Percent of Households with Owner Costs of 30% or More of Income
| Percent Change | ||||
| Area | 2018 | 2023 | 2018 - 2023 | |
| Chase | 18.8 | 14.9 | -20.6 | |
| Geary | 23.2 | 23.4 | 0.6 | |
| Lyon | 15.2 | 15.6 | 2.3 | |
| Morris | 18.8 | 20.7 | 10.0 | |
| Pottawatomie | 17.8 | 13.2 | -25.5 | |
| Riley | 18.8 | 17.7 | -6.0 | |
| Wabaunsee | 16.2 | 16.1 | -0.3 | |
| Flint Hills Regional Council Average | 18.4 | 17.4 | -5.6 | |
| State of Kansas | 17.7 | 17.1 | -3.3 | |
| United States | 23.3 | 22.2 | -4.4 | |
Source: U.S. Census Bureau, American Community Survey five-year average ending in year shown.
Percent of Households with Renter Costs of 30% or More of Income
| Percent Change | ||||
| Area | 2018 | 2023 | 2018 - 2023 | |
| Chase | 52.6 | 19.5 | -62.9 | |
| Geary | 44.7 | 42.3 | -5.4 | |
| Lyon | 46.6 | 43.4 | -6.9 | |
| Morris | 30.0 | 20.6 | -31.3 | |
| Pottawatomie | 38.9 | 39.0 | 0.3 | |
| Riley | 55.1 | 52.3 | -5.1 | |
| Wabaunsee | 22.3 | 36.2 | 62.3 | |
| Flint Hills Regional Council Average | 41.5 | 36.2 | -12.7 | |
| State of Kansas | 44.1 | 43.4 | -1.6 | |
| United States | 50.2 | 50.4 | 0.4 | |
Source: U.S. Census Bureau, American Community Survey five-year average ending in year shown.