

| Select a region: | Map of State of Kansas |
Business & Industry

Civilian Labor Force
| Percent Change | ||||
| Area | 2020 | 2024 | 2020 - 2024 | |
| Kansas | 1,501,633 | 1,545,790 | 2.9 | |
Source: U.S. Department of Labor, Bureau of Labor Statistics (BLS)
Also see:
- [Table] Monthly Labor Force Estimates in Kansas, by County
- [Table] Monthly Employment Estimates in Kansas, by County
- [Table] Monthly Unemployment Estimates in Kansas, by County
- [Table] Monthly Unemployment Rate in Kansas, by County
- [Interactive Dashboard] Local Area Unemployment Statistics (Kansas Labor Market Information Services)
Employment and Unemployment Rate
| --- Employment --- | -- Unemployment Rate -- | |||||||
| Percent Change | Percent Change | |||||||
| Area | 2020 | 2024 | 2020 - 2024 | 2020 | 2024 | 2020 - 2024 | ||
| Kansas | 1,414,277 | 1,490,553 | 5.4 | 5.8 | 3.6 | -37.9 | ||
Source: U.S. Department of Labor, Bureau of Labor Statistics (BLS)
Also see:
- [Table] Monthly Labor Force Estimates in Kansas, by County
- [Table] Monthly Employment Estimates in Kansas, by County
- [Table] Monthly Unemployment Estimates in Kansas, by County
- [Table] Monthly Unemployment Rate in Kansas, by County
- [Interactive Map] Current Monthly Labor Force & Unemployment Rates, by County (Kansas Labor Market Information Services)
Commuting Patterns
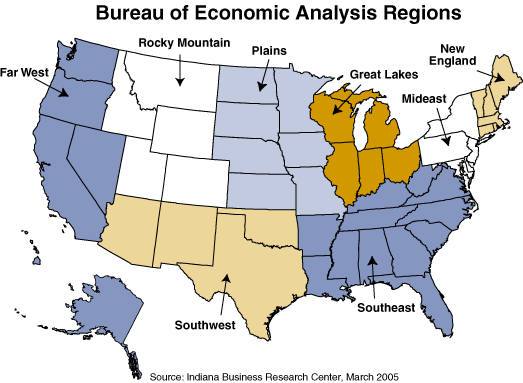
2016-20 County-to-County Worker Flow by Region
[Click to enlarge]
States are grouped by BEA Region (http://www.stats.indiana.edu/maptools/maps/boundary/bea_regions.gif) with the exception of Colorado, Missouri, Nebraska, and Oklahoma which are shown individually.
Kansas counties that are not in an EDD (Brown, Douglas, Franklin, Jackson, Jefferson, Nemaha, Osage, and Shawnee) are shown combined with the MO-KAN counties (Atchison and Doniphan) as Northeast Kansas. A reference map of regions in Kansas is available in PDF and JPG.
Kansas counties that are not in an EDD (Brown, Douglas, Franklin, Jackson, Jefferson, Nemaha, Osage, and Shawnee) are shown combined with the MO-KAN counties (Atchison and Doniphan) as Northeast Kansas. A reference map of regions in Kansas is available in PDF and JPG.
Also see:
- [Interactive Map] Local Employment Dynamics - OnTheMap (U.S. Census Bureau)
Occupation
| Percent Change | ||||
| Occupation | 2018 | 2023 | 2018 - 2023 | |
| Civilian employed population, 16 years and over | 1,428,660 | 1,454,760 | 1.8 | |
| Management, business, science, and arts occupations | 543,697 | 601,740 | 10.7 | |
| Sales and office occupations | 300,794 | 283,703 | -5.7 | |
| Service occupations | 237,349 | 226,719 | -4.5 | |
| Production, transportation, and material moving occupations | 209,284 | 209,464 | 0.1 | |
Source: U.S. Census Bureau, American Community Survey five-year average ending in year shown.
Also see:
- [Interactive] Occupation Clusters (StatsAmerica)
Average Wage Per Job
| Percent Change | ||||
| Area | 2017 | 2022 | 2017 - 2022 | |
| Kansas | 52,915 | 62,646 | 18.4 | |
Source: U.S. Bureau of Economic Analysis, Regional Economic Information System (REIS)
Due to budget constraints, the Bureau of Economic Analysis no longer produces this estimate for counties. This section will be removed from this portal in a future update.
Agriculture - Farm Employment
| Percent Change | ||||
| Area | 2017 | 2022 | 2017 - 2022 | |
| Kansas | 61,876 | 61,129 | -1.2 | |
Source: U.S. Bureau of Economic Analysis, Regional Economic Information System (REIS)
Due to budget constraints, the Bureau of Economic Analysis no longer produces this estimate for counties. This section will be removed from this portal in a future update.
Also see:
Energy - Oil and Gas Production
Oil Production (Barrels) | Percent Change | |||
| Area |
2020 | 2024 | 2020 - 2024 | |
| Kansas | 28,261,782 | 26,829,113 | -5.1 | |
Gas Production (Thousands of Cubic Feet) | Percent Change | |||
| Area | 2020 | 2024 | 2020 - 2024 | |
| Kansas | 164,305,915 | 126,716,141 | -22.9 | |
Source: Kansas Geological Survey, Oil and Gas Production in Kansas
Also see:
- [Tables, Maps, & Graphs] Kansas Statistical Abstract - Energy Chapter
- [Interactive] State Energy Profile (U.S. Department of Energy)
- [Interactive] State & Local Energy Data (U.S. Department of Energy)
Retail Trade - Employment
| Percent Change | ||||
| Area | 2017 | 2022 | 2017 - 2022 | |
| Kansas | 186,630 | 178,827 | -4.2 | |
Source: U.S. Bureau of Economic Analysis, Regional Economic Information System (REIS)
Due to budget constraints, the Bureau of Economic Analysis no longer produces this estimate for counties. This section will be removed from this portal in a future update.
Also see:
High Growth Industries
| Employment in High Growth Industries | 2019 | 2024 | Percent Change |
| Communications Equipment Manufacturing | 790 | 4,480 | 467.3 |
| Other Investment Pools and Funds | 12 | 55 | 380.4 |
| All Other Telecommunications | 100 | 243 | 143.1 |
| Software Publishers | 1,206 | 2,873 | 138.2 |
| Other Support Activities for Transportation | 37 | 67 | 82.9 |
Source: U.S. Census Bureau, Local Employment Dynamics.
LED data are designed to preserve employment trends while protecting the data of individual firms. Data are suppressed where they do not meet publication standards. Use caution when using individual counts by industry.
Also see:
- [Interactive] Explore all industries (IPSR)
Top Industries
| Top Industries by Employment | 2019 | 2024 | Percent Change |
| All NAICS Sectors | 1,145,620 | 1,180,556 | 3.0 |
| Restaurants and Other Eating Places | 90,002 | 94,565 | 5.1 |
| General Medical and Surgical Hospitals | 50,441 | 54,418 | 7.9 |
| Aerospace Product and Parts Manufacturing | 35,217 | 29,219 | -17.0 |
| Warehouse Clubs, Supercenters, and Other General Merchandise Retailers | 23,035 | 26,565 | 15.3 |
| Individual and Family Services | 24,393 | 25,103 | 2.9 |
Source: U.S. Census Bureau, Local Employment Dynamics.
LED data are designed to preserve employment trends while protecting the data of individual firms. Data are suppressed where they do not meet publication standards. Use caution when using individual counts by industry.
Also see:
- [Interactive] Explore all industries (IPSR)
Industry Clusters
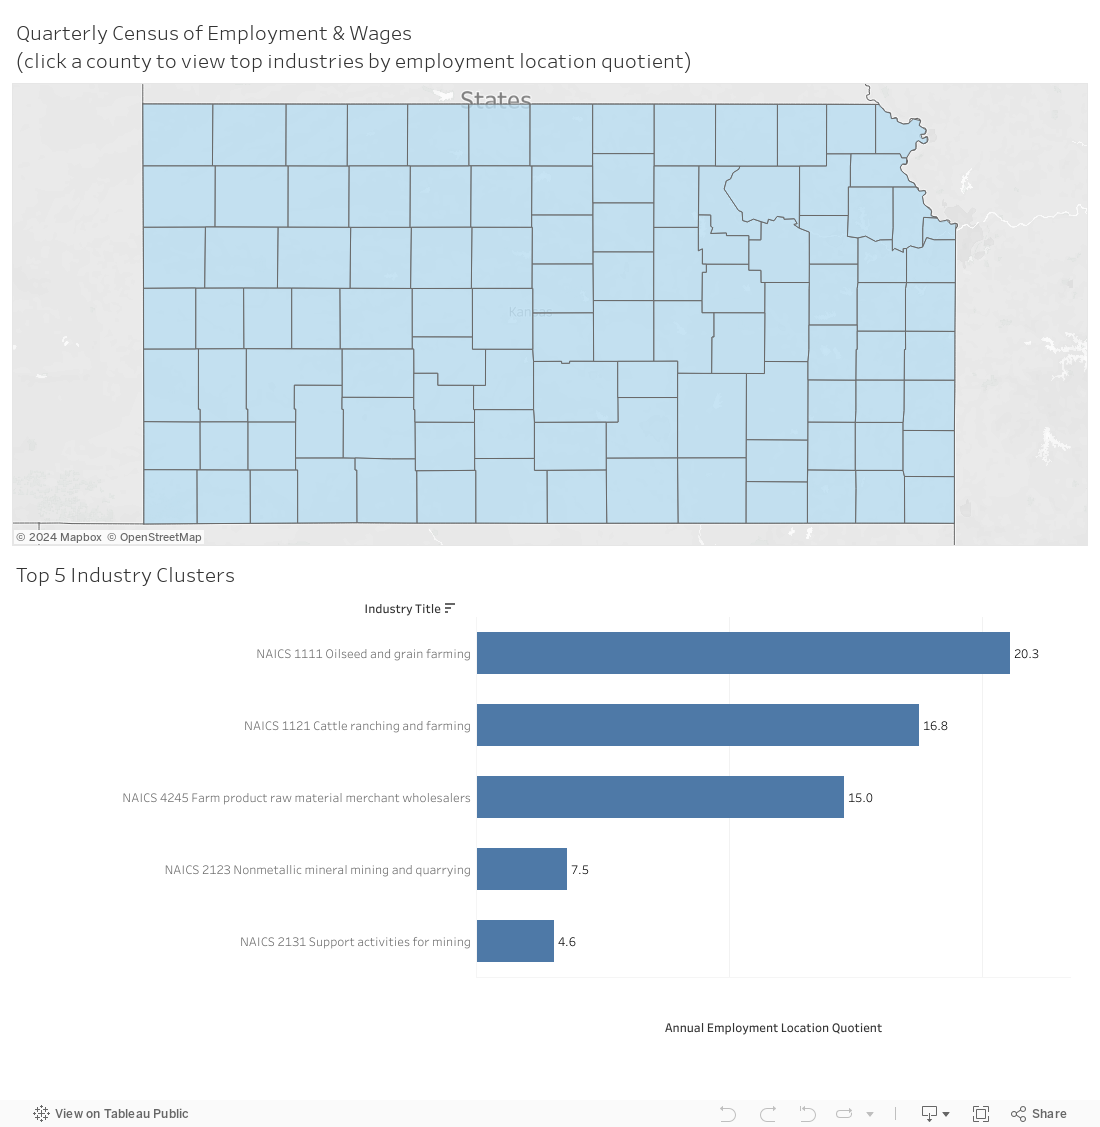
QCEW Location Quotient Details
Data above are annual averages in 2022 for private industries. Location quotients are ratios that allow an area's distribution of employment by industry to be compared to the national average. If an LQ is equal to 1, then the industry has the same share of its area employment as it does in the nation. An LQ greater than 1 indicates an industry with a greater share of the local area employment than is the case nationwide. Read more at: https://www.bls.gov/cew/about-data/location-quotients-explained.htm
Source: U.S. Department of Labor, Bureau of Labor Statistics (BLS), Quarterly Census of Employment & Wages (QCEW), 2022 Annual Averages.