Kansas State Data Center
Home
About SDC
Network
News
Data
Kansas Regional Data Portal
Select a region:
State of Kansas
Flint Hills Regional Council
Glacial Hills RC&D
Great Plains Development, Inc.
North Central Kansas Regional Planning Commission
Northwest Kansas Planning and Development Commission
South Central Kansas Economic Development District
Southeast Kansas Regional Planning Commission
Project 17 - Southeast Kansas
Allen County, Kansas
Anderson County, Kansas
Atchison County, Kansas
Barber County, Kansas
Barton County, Kansas
Bourbon County, Kansas
Brown County, Kansas
Butler County, Kansas
Chase County, Kansas
Chautauqua County, Kansas
Cherokee County, Kansas
Cheyenne County, Kansas
Clark County, Kansas
Clay County, Kansas
Cloud County, Kansas
Coffey County, Kansas
Comanche County, Kansas
Cowley County, Kansas
Crawford County, Kansas
Decatur County, Kansas
Dickinson County, Kansas
Doniphan County, Kansas
Douglas County, Kansas
Edwards County, Kansas
Elk County, Kansas
Ellis County, Kansas
Ellsworth County, Kansas
Finney County, Kansas
Ford County, Kansas
Franklin County, Kansas
Geary County, Kansas
Gove County, Kansas
Graham County, Kansas
Grant County, Kansas
Gray County, Kansas
Greeley County, Kansas
Greenwood County, Kansas
Hamilton County, Kansas
Harper County, Kansas
Harvey County, Kansas
Haskell County, Kansas
Hodgeman County, Kansas
Jackson County, Kansas
Jefferson County, Kansas
Jewell County, Kansas
Johnson County, Kansas
Kearny County, Kansas
Kingman County, Kansas
Kiowa County, Kansas
Labette County, Kansas
Lane County, Kansas
Leavenworth County, Kansas
Lincoln County, Kansas
Linn County, Kansas
Logan County, Kansas
Lyon County, Kansas
McPherson County, Kansas
Marion County, Kansas
Marshall County, Kansas
Meade County, Kansas
Miami County, Kansas
Mitchell County, Kansas
Montgomery County, Kansas
Morris County, Kansas
Morton County, Kansas
Nemaha County, Kansas
Neosho County, Kansas
Ness County, Kansas
Norton County, Kansas
Osage County, Kansas
Osborne County, Kansas
Ottawa County, Kansas
Pawnee County, Kansas
Phillips County, Kansas
Pottawatomie County, Kansas
Pratt County, Kansas
Rawlins County, Kansas
Reno County, Kansas
Republic County, Kansas
Rice County, Kansas
Riley County, Kansas
Rooks County, Kansas
Rush County, Kansas
Russell County, Kansas
Saline County, Kansas
Scott County, Kansas
Sedgwick County, Kansas
Seward County, Kansas
Shawnee County, Kansas
Sheridan County, Kansas
Sherman County, Kansas
Smith County, Kansas
Stafford County, Kansas
Stanton County, Kansas
Stevens County, Kansas
Sumner County, Kansas
Thomas County, Kansas
Trego County, Kansas
Wabaunsee County, Kansas
Wallace County, Kansas
Washington County, Kansas
Wichita County, Kansas
Wilson County, Kansas
Woodson County, Kansas
Wyandotte County, Kansas
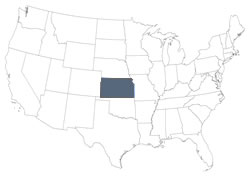
Map of State of Kansas
Demographics
Housing
Business & Industry
Healthcare
Quality of Life
Infrastructure
Natural Resources
Quality of Life
•
Median Household Income
•
Per Capita Personal Income
•
Poverty
•
Child Care
•
Educational Opportunities
•
Recreational Areas
Median Household Income
Percent Change
Area
2018
2023
2018 - 2023
Kansas
57,422
72,639
26.5
United States
60,293
78,538
30.3
Source: U.S. Census Bureau, Decennial Census (- 2000), (2009 -) American Community Survey five-year average ending in year shown.
[Click to enlarge]
Per Capita Personal Income
Percent Change
Area
2019
2023
2019 - 2023
Kansas
52,156
66,115
26.8
United States
55,567
69,810
25.6
Source: U.S. Bureau of Economic Analysis, Regional Economic Information System (REIS)
[Click to enlarge]
POVERTY
--- Number ---
-- Percent --
Percent Change
Percent Change
Area
2019
2023
2019 - 2023
2019
2023
2019 - 2023
Kansas
319,931
319,815
0.0
11.3
11.2
-0.9
Source: U.S. Census Bureau, Small Area Income and Poverty Estimates
[Click to enlarge]
[Click to enlarge]
Child Care
Educational Opportunities
Recreational Areas
>>> Go to
Infrastructure
Please send feedback or questions to
KansasSDC@ku.edu
© The University of Kansas. Design by
FreeCSSTemplates.org
. Photos by
Fotogrph
. All images are licensed under the Creative Commons Attribution 3.0 License.